Lat:39° 44' 24" Long: -105° 2' 59.99"
BLUEPRINT DENVER EQUITY INDEX MAP APPLICATION
The concept of equity is built into the Blueprint Denver plan. This is accomplished by using several equity indicators to help drive the plan and implementation with the goal to help make Denver a more equitable city overall. The equity indicators are Access to Opportunity, Vulnerability to Displacement, Housing Diversity, and Jobs Diversity.
The excerpt to the right outlines the explanation of the equity indicators in the Denver Blueprint plan.
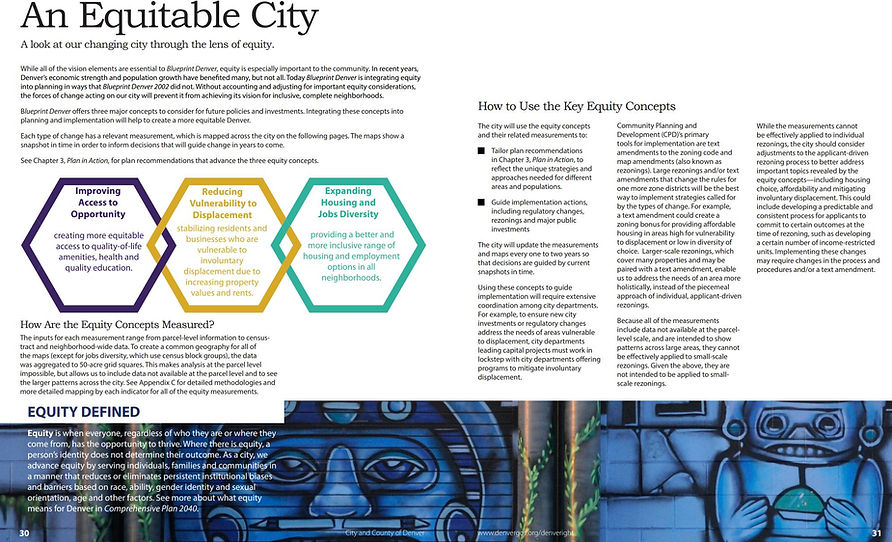
Each of the indicators are cumulative scores based upon many sub-indicators, sub-measurements, and data analysis. The published version of Blueprint displays maps of the cumulative opportunity scores. In addition, the plan does provide an appendix which explains the general methods and individual sub-indicators. However, it lacks the ability to dive deeper into the data.
The Blueprint Equity Indicators storymap application addresses this problem. I created a storymaps that contains a web map applications that allows both planners and the public to explore each equity index in more detail. For each equity indicator, users can zoom into the map to explore the actual composite data as well as the sub-indicator results. Users can change the data layers to interact with the sub-indicator data. This application provides greater transparency into how the total scores were derived. It is also a small step in providing data to users in the fight to bridge the digital divide and make Denver a more equitable city.
Explore the Blueprint Equity Indicators Map Application below. For best results, view the storymap here.
Source: Blueprint Denver, https://www.denvergov.org/media/denvergov/cpd/blueprintdenver/Blueprint_Denver.pdf, pages 30-31.